
Interpine’s TreeTools VirtualPlot Forest Inventory tool has been developed for foresters to assess stocking in silvicultural operations during forest management. Using a drone, you can create virtual plots both onsite and offline in the forest, aiding in decision-making. This is an early beta test version release for Windows operating systems.
The purpose of the release is to give stakeholders an opportunity to test and provide feedback, while encouraging them to submit more data. The accuracy of the stocking assessment depends on factors like canopy recognition effectiveness and drone altitude precision.
Our goal is to keep the stocking error below 10% under normal conditions.
The following provides an overview for data capture and a guide to using the software.
This project has been developed with funding assistance from the Precision Silviculture Programme, A Sustainable Food and Fibre Futures (SFFF) partnership between MPI and the forest industry led by Forest Growers Research. This is freely available during the development funding to provide for industry feedback.
Drone Support
A list of currently supported drones and drone sensors is provided below. Where Interpine has completed custom calibration of a drone’s camera sensor field of view (FoV) in our test environment, the use of these drones provides the highest quality results. Where custom calibration has not been completed, Virtual Plot will still provide results based on the manufacturer’s FoV specifications. These results may not be optimal but may still be suitable for many applications.
If you have a specific drone or camera sensor you would like supported with a custom calibration, please reach out to the team.
Full Support
- DJI Phantom 4 Pro
- DJI Phantom 4
- DJI Mavic Air
- DJI Mavic Pro
- DJI Mavic 2
- DJI Air 2S
- DJI Mini 4 Pro
- DJI Mavic 3 Enterprise
- DJI Mavic 3 Multispectral
- DJI Matrice 4E
- DJI L1 LiDAR – RGB Sensor
- DJI L2 LiDAR – RGB Sensor
- DJI P1 24mm, 35mm RGB Sensors
What’s New
The latest software release notes and feature availability is shown below.
| Version | Release Notes |
|---|---|
| 2.10 Pro (20/10/25) | 1. Update Post-Thinning Model to Radiata pine Thinning Model v8 2. Turn initial License generation function off |
| 2.10 (19/09/2025) | 1. Add boundary option to enable images selection in stand 2. Add a refining module for manually tree detection correcting |
| 2.09 (11/08/25) | 1. Refined the parameters for better virtual plot size estimates 2. Update Post-Thinning Model to Radiata pine Thinning Model v7 3. Update Age 1-2 model to Radiata Pine Age 1-2 Model v2 4. Update Age 3-4 model to Radiata Pine Age 3-4 Model v2 5. Refine DTM format interface |
| 2.08 (06/06/25) | 1. Change Virtual Plot algorithm methodology for conveniently adding more camera types. 2. Add confidence parameter setting into “3. AI Detection Parameters” module. It could be useful for controlling missing tree and false positive problems. 3. Split “Early age assessment” model into two separate models: “Age 1-2 assessment” and “Age 3-4 assessment”. The former is for age 1-2, and the latter is for age 3-4. 4. Update Post-Thinning AI Model to Radiata pine Thinning Model v6. 5. Move “Tree Height est.” parameter into “1. Dataset Parameters” module. |
| 2.07 (19/05/25) | 1. Update Early Age Assessment AI Model for including younger trees like age 2. (Radiata pine Early Age Model v3) |
| 2.06 (09/05/25) | 1. Update Post-Thinning AI Model with more training data. (Radiata pine Thinning Model v5) 2. Improve the interface for “DTM Converter” |
| 2.05 (28/03/25) | 1. Fix an error of AGL calculation using take-off photo on 2.03/2.04. NOTE: The outputs using take-off photo could be wrong in 2.03/2.04. Please update to at least this version for a correct take-off photo + DTM function. 2. Allow NZTM NZVD2016 DTMs. Select “Vertical Datum” after uploading DTM. The default value is “NZVD2016” for the convenience of NZ users. Currently it supports both NZVD2016 and Ellipsoidal vertical datums, and the horizontal coordinates could be NZTM2000 or WGS84. 3. Add “DTM Converter” function in “Tools” menu beside “Help” for converting NZTM NZVD2016 DTMs to WGS84 Ellipsoidal, which could be useful for DJI flight planning. 4. Update Post-Thinning AI Model with more training data. (Radiata pine Thinning Model v4) |
| 2.04 (5/03/25) | 1. Improved user interface for image processing workflow. 2. Inclusion of DTM and Take-Off image names if loaded for use, into the results.csv file. (28/03/2025) NOTE: The outputs using take-off photo could be wrong in this version. Please update to at least 2.05. |
| 2.03 (28/02/25) | 1. Add a function of using take-off photo + DTM to determine AGL for drone types not supporting recording of height above ellipsoid and only height above take off point, like DJI Phantom 4 Pro, DJI Mavic 2, etc. The take-off photo has to be taken at the take-off point with the drone on the ground. (28/03/2025) NOTE: The outputs using take-off photo could be wrong in this version. Please update to at least 2.05. 2. Update calibration parameters for DJI L2 LiDAR – RGB Sensor and DJI Mavic 3 Multispectral, which are also supported by the DTM function. 3. Update Post-Thinning AI Model with more training data. (Radiata pine Thinning Model v3) 4. Update Early Age Assessment AI Model with more training data. (Radiata pine Early Age Model v2) |
| 2.02 (20/01/25) | 1.Update calibration parameters for DJI L1 LiDAR – RGB Sensor. |
| 2.01 (19/12/24) | 1. Improve the interface to make it more user-friendly. Added video processing function and stream processing function. 2. Both video process and stream process need to choose drone type first. The video process is designed so that you can figure it out how to use it at a glance. Click “Save” button to save the current result and click “Exit” to terminate the process and a Summary.csv will be generated. 3. For real-time stream process, before clicking “GetIP” button your computer and your drone’s controller need to be in a same Local Area Network (LAN). The practical way of doing this is to turn on your phone’s hotspot and connect both your computer and your drone’s controller to the hotspot. It doesn’t need your phone has to catch signal in field. After connecting successfully, click “GetIP” button and the RTMP address will be printed on the right-side console window. Then type it to your drone controller and start streaming. The video stream will be pushed to your computer. Select the correct drone type and click “Video Stream Go” button. You should see the real-time inference result comes up. Fly your drone to look around. Click “Save” button to save the current result at any time and click “Exit” to terminate the process and a Summary.csv will be generated. |
| 1.04 (6/12/24) | 1. Updated the post-thinning model. 2. Added a function of using DTM to obtain flight height smartly and more precisely. Now the DTM method only supports DJI Mavic 3 Enterprise and DJI L1 RGB Sensor. The best DTM should be 1m tiles, and the coordinate system has to be WGS84 + Ellipsoidal Height. |
| 1.03 (15/11/24) | Added a new column ‘PlotsToReach10PctPLE‘ in ‘Summary.csv’ to suggest how many plots are needed to reach 10% PLE. |
| 1.02 (11/11/24) | Added a KMZ output, where all output results can be easily opened in Google Earth Pro. |
| 1.01 (5/11/24) | Initial beta release for testing and development purposes. Currently supported drones are the DJI Phantom 4 Pro, Mavic 2, Mavic 3 Enterprise. |
Capturing Data with Your Own Drone
The following guidelines will help you in capturing data using your drone for use with TreeTools VirtualPlot.
Please follow the suggested flight parameters below for data collection, and feel free to ask any questions if you have them.
| Flight Parameter | Suggestion |
|---|---|
| Flight App | Any app will be sufficient as long as it supports terrain awareness / terrain follow. Maps Made Easy – Tag Pilot, for DJI Mavic 2, DJI Phantom series drones. Maps Made Easy – Map Pilot Pro, for the DJI Mavic 2, DJI Phantom series drones. DJI Pilot 2, for the DJI Matrice series, DJI Mavic 3 Enterprise drones. UgCS, for more complex flight planning. |
| Flight height above ground level | between 100-120 m. Preference to 120m as this provides a larger plot size. A larger plot size is more tolerant to getting precise results with tree stocking. |
| Flight speed | between 8 to 12 m/s. The key is reducing motion blur in the imagery to keep good tree detection quality. – if windy consider 8-10 m/s to reduce motion blur in moving trees). – if clear and little wind 10-12m/s should be fine). |
| Terrain Awareness | Terrain Awareness is also required so that the drone can maintain a constant height above ground during the flight. Using Tag Pilot terrain AGL lock mode. Using Map Pilot terrain follow mode. Using DJI Pilot 2 and need to create a GeoTIFF DTM file to load, follow this article. Using UgCS terrain follow mode. Using DJI Pilot 2 Real-time Terrain Follow |
| For Drones Only Reporting Height Above Take Off Point | For users of the DJI Phantom series, DJI Mavic 1 and 2, that only record height above take off point within each photo (not height above WGS84 ellipsoid), we recommend taking a photo on the ground at the takeoff point. This can then be uploaded during processing together with the DTM, to provide precise plot area measurements. See how this is used during processing. If your using Maps Made Easy Map Pilot, this software takes a ground image for you. |
| Terrain Conditions | In rolling to steep terrain, you will get optimized results by adding a DTM during processing. Find out more here. |
| Gimbal Pitch | 90 Degrees (looking straight down). Images to far outside this range will not be processed. |
| Lighting conditions | Sunny or Cloudy – detection algorithm trained on a range of lighting conditions. |
| Overlap | Dependent only on the required plot intensity across the flight area. Suggest 50% or less. It is not required to have any image overlap in the flights to process with TreeTools VirtualPlot. |
Video Tutorial
Getting Started – the Basics of Virtual Plotting
A quick start video to get you up and running using the image processing workflow.
Using Digital Terrain Models to Enhance Results
You can now use a DTM to improve the results, especially in steep terrain. This works for all supported drones types.
Get Started
Download, Open and Activate License
Request to download the software using our contact form. After downloading the software, simply double-click to use. The software does not require any installation and can be run directly from the application file downloaded.
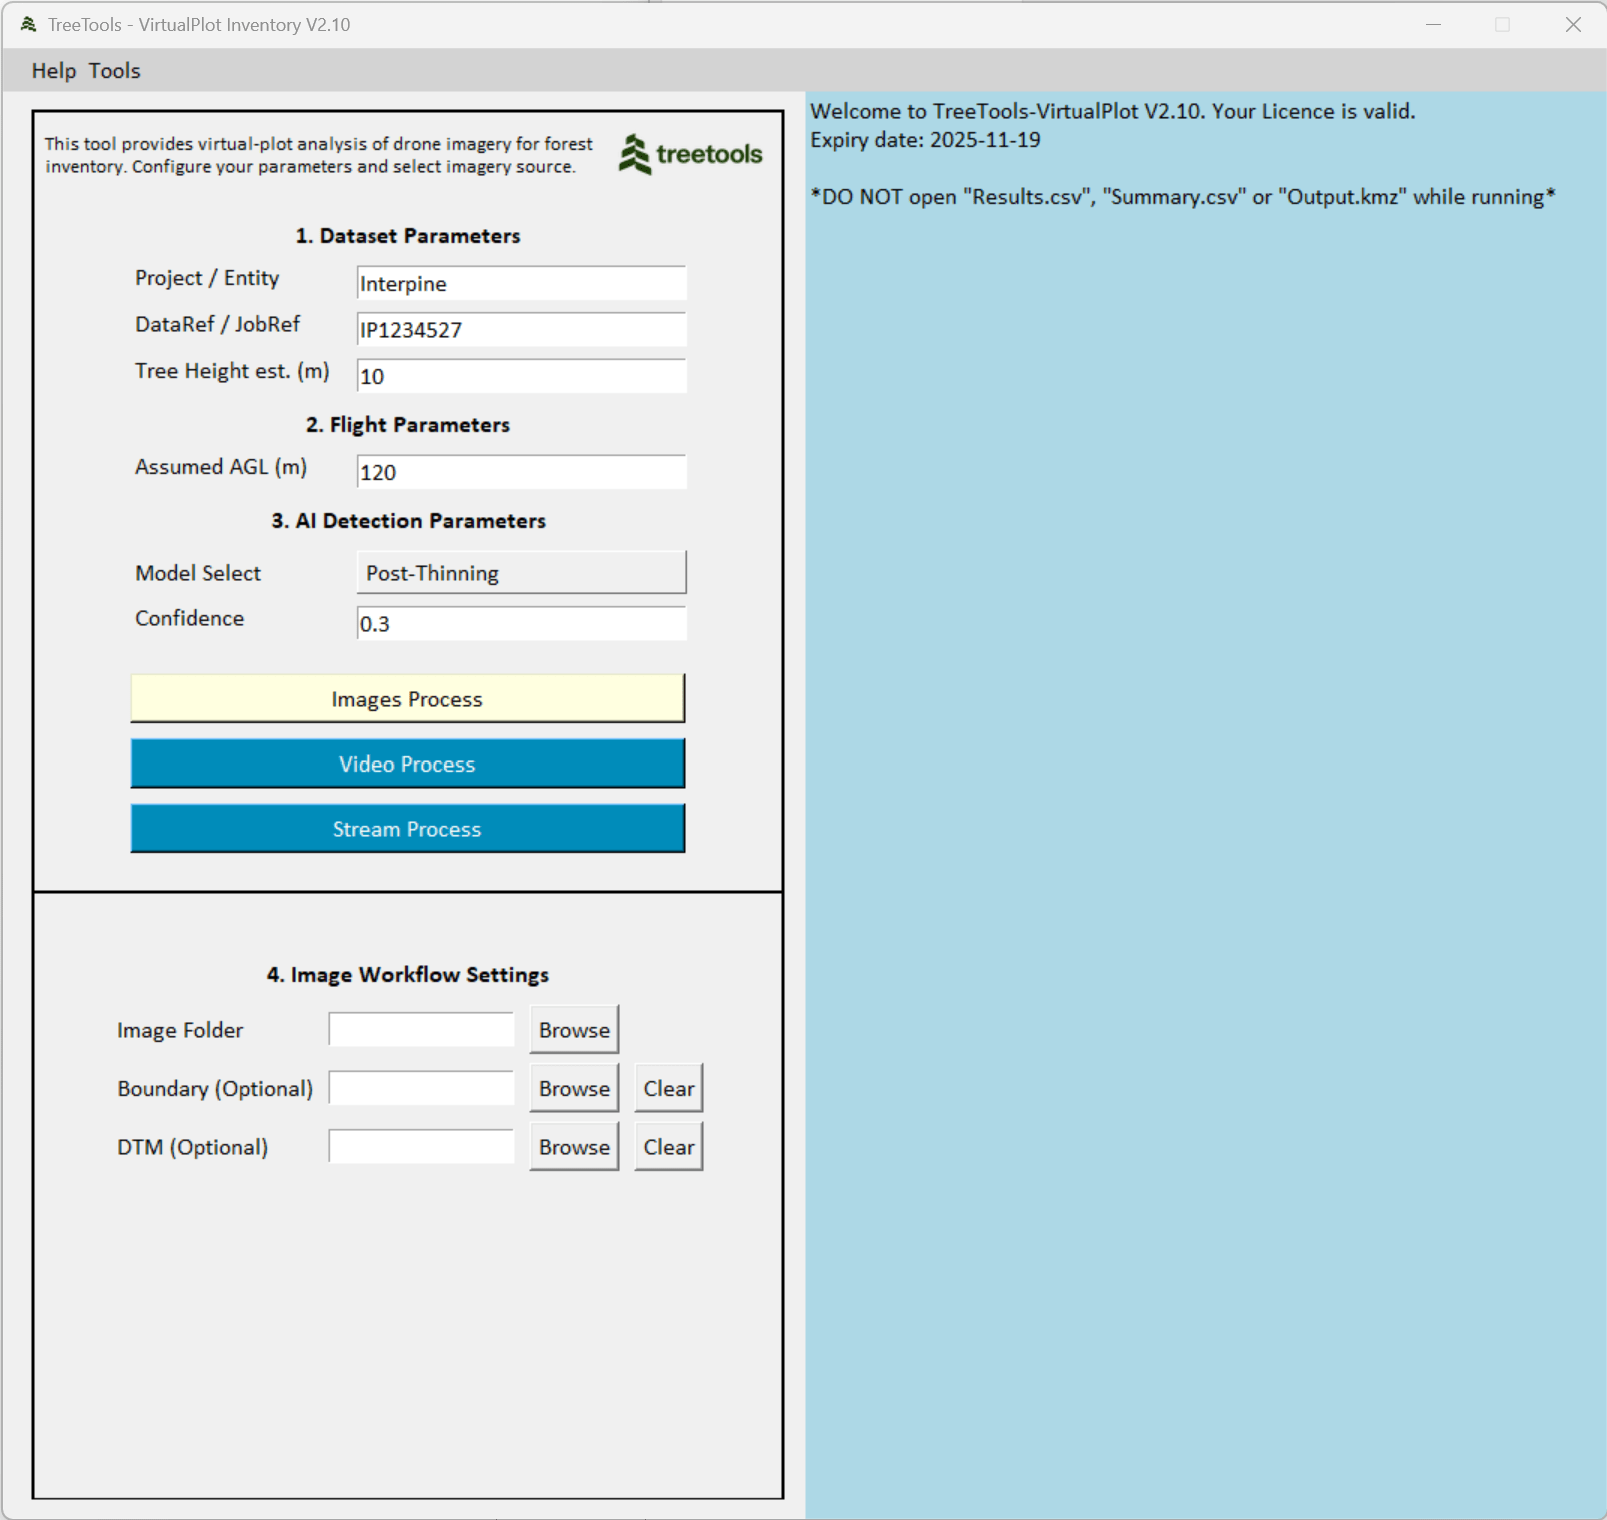
The following GUI will appear. You will notice a 2-month license will initially be provided for testing and evaluation.

If your license expires, contact our team and get a renewal code which can be entered in the Help > License Renewal menu.
Set Initial Parameters
Initial parameters allow you to define the analysis project.
| Parameter | Description / Use |
|---|---|
| Project / Entity | A reference for your own use. This is output in the final data and can be used to link the data back to a client name, project, forest-compartment-stand for example. e.g. MATA-101-3 |
| DataRef / JobRef | A reference for your own use. This is output in the final data and can be used to link the data back to a specific job, contractor, operator for example. Useful to make this the Job Number from GeoMaster is using the inventory import function. e.g. J10234 |
| Tree Height est (m) | The average tree height roughly estimated for the target area in meters. This is used to approximate the distance from the drone to the treetops based on the assumed AGL. Therefore, the plot area is calculated at the treetops rather than ground level, as the detection algorithm considers the treetops are the inclusion/exclusion criteria for stocking counts. Typically, just an estimate +/- 5m would be fine. e.g. 10 |
| Assumed AGL (m) | Assumed flight height above the ground (AGL) in meters. This should be set to the altitude used for the terrain following AGL used during flight operations. Can be approximate if also planning to analyze using a DTM (digital terrain model) as the DTM will be used to further refine the analysis when made available. e.g. 120. “Assumed AGL” also influences the virtual plot size as using DTM or DTM+Take-Off functions. Bigger Assumed AGL for larger virtual plot. |
| Model Select | This is the AI model which will be used to detect the trees. e.g. Post-Thinning |
| Confidence | The confidence adjustment could be useful for controlling missing tree and false positive problems. Lower confidence could help decrease missing trees. Higher confidence could help remove false positives. Default recommended setting is provided, but users can tweak to revise the Ai detection to suit the forest type. |
Selecting the AI Tree Detection Model
When deciding to select the appropriate AI model it is worth considering the data in which it has been trained on. Part of the development of tree tools is the extension of models available for end users. If you have data you can contribute to train the models for specific species and operation types, just reach out to us.
| Model Name | Model Description |
|---|---|
| Post-thinning | Species: Radiata pine. Ages: 5-10 years. This model has mostly been trained for use for post waste thinning silviculture operations, but could also be used successfully for pre-thinning assessment in these age ranges. It may not perform well in preassessment when the forest has reached full canopy closure. |
| Age 1-2 Assessment | Species: Radiata pine. Age 1-2 years. |
| Age 3-4 Assessment | Species: Radiata pine. Age 3-4 years. |
Select a Data Input Type (Image, Video, Video Streaming)
Select one of 3 types of workflows for different input data sources.
Image
Analyse a Folder of JPEG Images
- Post processed imagery downloaded from drone.
- Select one or more folders.
- Each image becomes a virtual plot.
- Best Results
Video
Analyse a Video
- Post processing a video file downloaded from drone.
- Select a video file to process.
- Each frame of the video can be extracted as a virtual plot.
Stream
Live Video Streaming and Analysis.
- Fly and get immediate results live while in the air.
- Requires the drone and analysis computer to be on the same network (e.g. local Wi-Fi hotspot)
Images Processing Workflow
Image processing is often the easiest and best method to get good results. This will take a folder/s of images and analyze them, creating a virtual plot for each of the JPEG files located in the folder. TIP: consider cleaning up the folder prior to analysis, removing any images which are not relevant to your area of interest.
Selecting the images process button on the interface will expose a few extra parameters.
| Parameter | Description / Use |
|---|---|
| Image Folder | Select the folder of images to be processed. All subfolders of images in the folder will also be processed if present. |
| DTM (Optional) | Select a DTM to refine the AGL (m) and get higher precision results. Currently supporting both NZVD2016 and Ellipsoidal vertical datums, and the horizontal coordinates could be NZTM2000 or WGS84. This is recommended to improve the precision of the results in steeper forest areas. |
| Clear DTM | Clear or remove the use of DTM during processing. |
| Boundary (Optional) | Select an area of interest (AOI) boundary shape file. This would typically be a forest stand boundary. This will then filter the results for only those plots that fall within the boundary provided. Required format *.SHP (ESRI Shape file). |
| Vertical Datum | Select the vertical datum of the DTM uploaded. Currently supporting both NZVD2016 and Ellipsoidal vertical datums. |
| Take-Off Image | This image is used to calibrate to the provided DTM file, enabling precise plot area measurement. This is recommended when using a drone which only supports recording of height above take off point in the EXIF metadata within each image. Virtual Plot will prompt for this when this type of drone data is provided, and you have provided a DTM during analysis. Expecting an image file taken while drone is on the ground. Important Note: Images from different drone flights must not be saved in the same folder. A dedicated folder should be created for each individual flight. In this context, a single flight refers to a complete operation cycle: powering on the drone, takeoff, image acquisition, landing, and powering off. It is important to note that every time the drone is powered off and then restarted, its internal altitude reference is reset. As a result, using a takeoff image from a different flight will lead to errors in above-ground level (AGL) calculations. To ensure accuracy, always use the correct takeoff image corresponding to each specific flight. |
| Clear Take-Off Image | Clear or remove the use of a take-off image during processing. |
| GO | Start processing |
| PAUSE / CONTINUE | To pause and continue processing of selected folder of images. |
| STOP | Stop current processing. Will not complete the summary output files. |
Download Images and Select Folder/s of Images to be Processed
Once you have downloaded the images using an SD card from your drone. Click “Select a Folder of Images” button, then select the folder containing the target data.

Image Processing to Virtual Forest Inventory Plots
Using the Go button you can start the processing. The images in the folder, including those in the subfolders, will be processed one by one and shown on the screen. The stocking is represented as “TreesPerHectare”, together with a TreeCount. You will see each image pop up with the detection and stocking estimates as it is processed.
You can stop the processing at any stage using the Stop button. Once you processing is complete, check out the results

Improve Plot Area Precision Using a DTM
Providing a DTM to your processing workflow will improve your results by more precisely measuring the plot area. Terrain follow flights are often smoothed out flightpaths due to either use of a lower resolution terrain model or to avoid sharp drops or inclines in the drone flight. Therefore, even with a planned flight at 100m AGL (above ground level) you are likely to see variation in actual height above ground depending on the terrain of +/-10m or so. So, a way to compensate for this and get more precision from TreeTools VirtualPlot is to provide a 1m DTM which will be used to refine the flight height of the drone above ground for each image. For analysis in Virtual Plot, you will need to specify if the supplied DTM is in NZVD2016 or Ellipsoidal elevation heights. If the supplied DEM is in NZVD2016 Virtual Plot will do the conversion to Ellipsoidal heights automatically. As GeoTIFF files by themselves have no embedded geographic projection information, you will need to select this correctly to ensure you get the accurate results. Contact our team to support additional datums as needed.

Use of Take-Off Image for DTM AGL Correction
For drone types that do not support recording of height above ellipsoid and only height above take off point, like DJI Phantom 4, DJI Phantom 4 Pro, or DJI Mavic 2. Virtual Plot will prompt you to upload a take-off location photo. This should have been taken at the home point while the drone is on the ground. This allows for precise plot area calculations based on the provided DTM.


Video Processing Workflow
You can fly the drone, just collecting a video file and use this for extracting virtual plots. This is not as precise as using images but is a useful way to get quick results over specific areas.
Select the Video Process button on the interface will expose a few extra parameters.

| Parameter | Description / Use |
|---|---|
| Select a Video File | Select a video file for analysis |
| Drone Select | Select the type of drone you have. This ensure the correct camera sensor settings are selected. Unlike the image processing, this type of information is not available to TreeTools via the video streaming so must be set manually by selecting the drone type. Contact us if your drone type is not available. |
| Go | Start the video analysis. The results will be shown in the pop-up window. |
| Save | Save a plot result as output. You can select when a plot will be extracted and analyzed from the current view. |
| Exit | Stop current processing of video. |
| Video Navigation Timeline Select | Use the timeline to select specific parts of the video, by skipping forward or backward to select section of video for analysis. |
Streaming Video Live Analysis Workflow
Streaming the analysis live from the drone while in flight, provides a way for real-time results. A result will be shown approximately every 3 seconds during flight (when AGL and gimbal settings suitable). It is recommended this only be done when there if more than 1 person onsite. It is important the drone pilot is not distracted from their task of operating the drone safely. This works in a similar way to video processing where results will not be as precise as image processing option, and the output will not include the GPS location of each plot as this is not available as part of the live stream video feed from the drone.
Selecting the Stream Process button on the interface will expose a few extra parameters.

| Parameter | Description / Use |
|---|---|
| Drone Select | Select the type of drone you have. This ensure the correct camera sensor settings are selected. Unlike the image processing, this type of information is not available to TreeTools via the video streaming so must be set manually by selecting the drone type. Contact us if your drone type is not available. |
| Get IP | Selecting this provides the RTMP address of the device for input into the drone application. This will be displayed in the log window to the right. Goto your drone application, and select Video Streaming output. You can select RTMP Server and type in / copy the URL provided and select Start Streaming on the drone app. |
| Video Stream Go | Start the video streaming analysis. |
The drone tablet / controller and your analysis computer need to be on the same WiFi network for this to work. The practical way of doing this is to turn on your phone’s hotspot and connect both your computer and your drone’s controller to the hotspot. This does not require mobile reception / internet reception in the field, just the WiFi hotspot connecting the two devices.
Results and Outputs
After the processing is complete, the following outputs and reporting is provided.

| Output | Description |
|---|---|
| Results.csv | Virtual plot listed for each image processed or selected for output. Includes attributes for each plot including tree count, stocking, and a range of input and analysis parameters. A full list of data types is available below. |
| Summary.csv | Contains the averages and statistical analysis for the folders/s processed. Includes statistics such as PLE (95% CI over the mean as a %), and an estimate of plots required to achieve 10% PLE. A full list of data types is available below. |
| Output.kmz | The KMZ file can be opened in Google Earth Pro to view the images in their spatial location. |
| <image>_result.jpg | In the source folder a output of each virtual plot is provided with the suffix “_result”. |
The output images for every submitted image can be double-checked manually to correct the stocking information. For example, if you find a missing tree in the yellow plot circle, then add a “TreeFreq” to the “TreesPerHectare” number for a correction to the stocking. On the other hand, if you find an area that is mistakenly marked as a tree but isn’t one, then subtract a “TreeFreq” from the “TreesPerHectare” number.
File Format: Results.CSV
| Field Name | Description |
|---|---|
| TreeToolsVersion | Software version release. |
| Entity | Parameter Input: custom field input by user. |
| JobRef | Parameter Input: custom field input by user. |
| PhotoPath | Directory path of the input image. |
| DateTime | Date and time of the image taken. |
| Latitude | Latitude location of the plot center (degrees). |
| Longtitude | Longitude location of the plot center (degrees). |
| AiModel | AI model applied. Includes a version of model. This version number is considered independent from the VirtualPlot software as it relates to the iteration of the Ai model training. |
| Confidence | Confidence used for tree detection. |
| TreePerHectare | Tree count * TreeFreq representing tree per hectare. Trees per hectare is not the same as stems per hectare. Under NZ standard mensuration conventions, a tree with two stems below breast height will contribute twice as many stems as trees to the plot level per hectare estimate. |
| TreeCount | Tree count within the bounded plot area. A tree is considered to count towards the stocking if the tree crown is at least 50% within with the plot boundary. This is calculated by the center point of the detection square as represented on the virtual plot image. |
| SampleArea | Bounded plot size (hectares). |
| Radius | Radius of the bounded plot (meters). |
| TreeFreq | The number of trees per hectare represented by this tree. The frequency is calculated as 1/(plot area) and all trees have the same frequency. |
| Resolution | Pixel image resolution of the input image processed. |
| Pitch | Camera gimbal angle (degrees). |
| HAE | Height above ellipsoid (meters). |
| AGL | Altitude above ground level (meters). |
| AGLSource | AGL source (and therefore confidence). – Manual, just using the user provided default parameter value of assumed AGL, by default plot size and FoV will remain constant. – DTM, refers to use of the digital terrain model input file. Currently, 2.05 supports both NZVD2016 and Ellipsoidal vertical datums, and the horizontal coordinates could be NZTM2000 or WGS84. – DTM+Takeoff, refers to use of the digital terrain model input, whereby calculated height above ground based on the difference from a take-off image at the home point ground location. |
| TreeHeight | Parameter input: approx crop tree height (meters). |
| Orientation | Drone heading (degrees). |
| DTM | Filename of the DTM used. |
| VerticalDatum | Vertical Datum of the DTM |
| TakeOffImage | Filename of the Take-off Image used. |
| DroneModel | Drone model detected from the EXIF data. |
| CameraModel | Camera model detected from the EXIF data. |
File Format: Summary.CSV
| Field Name | Description |
|---|---|
| TreeToolsVersion | Software version release. |
| Entity | Parameter Input: custom field input by user. |
| JobRef | Parameter Input: custom field input by user. |
| TotalImagesProcessed | Total images / virtual plots used to create the summary. |
| AverageTreeCount | Average tree count within the bounded plot area for each image processed. A tree is considered to count towards the stocking if the tree crown is at least 50% within with the plot boundary. This is calculated by the center point of the detection square as represented on the virtual plot image. |
| AverageTreesPerHectare | Average of the Tree count * TreeFreq representing tree per hectare for each image processed. Trees per hectare is not the same as stems per hectare. Under NZ standard mensuration conventions, a tree with two stems below breast height will contribute twice as many stems as trees to the plot level per hectare estimate. |
| TPH_SD | Trees per hectare standard deviation |
| TPH_CI95 | Trees per hectare 95% confidence interval. |
| TPH_PLE | Trees per hectare probable limit of error %. This being the 95% confidence interval divided by average trees per hectare represented as a %. |
| PlotsToReach10PctPLE | Estimated additional images / virtual plots required to reach a PLE of 10%. Will show zero where PLE is already below 10%. |
Importing Results to ArcGIS Pro
Importing Results to ArcGIS Pro. Use the “XY Table to Point” layer option to import the results.csv file for display in ArcGIS.
Importing Results to GeoMaster
Import into GeoMaster using the Inventory Import function from the Tools menu. Select the relevant Job Number field to link the inventory results to during the import.
More Information on How It Works
Here is some additional information for those guru’s keen to understand more. Click to expand the more detailed content.
What precision is expected in the measurement of horizontal plot area when using VirtualPlot?
Precision of the area measurement relies on the height above ground measurement, and calibration of the drone camera sensors FoV. The drone’s altitude is derived from the GNSS heights stored within each photo’s EXIF data. For drones using a RTK GNSS, the altitudes recorded are often with 5-15 centimeters and therefore will be the most precise for area measurement. Repetitive testing has been completed on a range of drone sensors using the test field layout as pictured below. This provides for refined custom FoV calibration for supported list of drones as well as the repetitive testing of altitude variation and the impact on area assessment completed 10 times per sensor. The results are shown below for some of the common drones used. This consistently shows error less than 2% for area assessment, and RTK GNSS enabled being 0.5%.

Typical Area Measurement Error Expected from Field Calibration Trials
| AGL (m) | DJI Mavic 3E (RTK) | DJI Mavic 3E | DJI Mavic 2 | DJI Phantom 4 Pro |
|---|---|---|---|---|
| 120 | +/- 0.5% | +/- 1.0% | +/- 0.8% | +/- 1.6% |
| 100 | +/- 0.4% | +/- 1.9% | +/- 1.0% | +/- 1.3% |
The AGL above ground is then determined by the quality and use of the digital terrain model. We recommend use of a DTM during analysis and have workflows for both older and newer drones to enable users to load a DTM. This will ensure the precision of the AGL is optimized for the site.
Tree stocking per hectare validation results?
The objective of the project is to gather more imagery from users to better train the Ai detection models. Therefore, as more Ai Models are trained and developed users will experience improvements in the model precision. Here is a snapshot of some of the field trials and client feedback. We will add to this over time and also welcome your own feedback.
Field Trials – Dec 2024. These results were using VirtualPlot V2.01, and Ai Model: Radiata pine Thinning Assessment V2.
Images were capture by a DJI Phantom 4. The camera FoV did not have a custom calibration. The model was not trained with images from this dataset. The flight height was noted by client as 120m, flat flight over the stand and not terrain following. A DTM was not used during the analysis. This stand predominately flat, but some minor variation terrain (+/-10m). In addition, based on the LiDAR data result the average tree height in this stand is around 11m. Therefore, with these parameters the radius of the yellow circle is calculated as 19.2m. The site has recent LiDAR over the stand.
This radius was compared with the real distance based on the LiDAR analysis. After analyzing 10 virtual plots, radius measurement error was = 19.2 ± 0.31 m. Therefore, the error for the area provided could be ±3.2%.
30 virtual plots were compared for tree detection performance. These two tables show the analysis results.
Confusion Matrix
| True Positives | False Positives | False Negatives |
|---|---|---|
| 2258 | 0 | 52 |
Performance Matrix
| Precision | Recall | F1 Score |
|---|---|---|
| 1 | 0.977 | 0.989 |
Finally, combining the tree detection error and virtual plot area error, the stocking error is estimated as ±5.5%. Our goal is to keep the stocking error below 10% under normal conditions, so the result in this stand is acceptable.
From this trial improvements with guidance around terrain awareness flights and processing with the DTM, and improvements in detection Ai models have been implemented.

The AGL above ground is then determined by the quality and use of the digital terrain model. We recommend use of a DTM during analysis and have workflows for both older and newer drones to enable users to load a DTM. This will ensure the precision of the AGL is optimized for the site.
Client Trial Jan 2025 Using VirtualPlot V2.01, and Ai Model: Radiata pine Thinning Assessment V2.
Waste thinning block, mixed terrain flown using terrain following using a Phantom 4 Pro using Map Pilot. Manual review of the tree detections showed on average 1.8 trees per plot missed Ai detection. The largest was 7 in one plot. It was simple to revise and review with the Tree Frequency provided on each image, allowing for adjustment to the stocking estimates and the average changed from 270 SPH prior to manual review to 287 SPH after. (+6.2%). This data was then used to improve and release a new Ai Model.
Client Trial Jan 2025 Using VirtualPlot V2.01, and Ai Model: Radiata pine Thinning Assessment V2.
Using a Mavic 3E, waste thinning block, steep terrain. Initially the client presumed they has used a terrain awareness flight of 120m AGL, but noted they had downloaded the DTM from LINZ website in WGS84 format. On review this was still in NZVD2016 height datum and therefore the flight was actually flown more like 106m AGL. Local variation in the steep terrain also shown the benefits of also including the 1m DTM in the analysis with actual AGL ranging from 90-110m due to gullies and ridges which were smoothed out by the flight planning software. Once processed with the DTM loaded into VirtualPlot the results were very close to expected and manual plotting operations. The client was also impressed at the Ai detection with very little if any trees missed and the native species in some areas not being detected, and excluded from the stocking counts.
Further Support
Thanks for using TreeTools VirtualPlot. Follow us for more detail on our product page.
We wrote these articles to equip you with everything you need to get the job done on your own, but we understand that sometimes this isn’t sufficient.
If you’re stuck, the Interpine support team may be able to help. You can contact them by submitting a contact request.
Trackbacks/Pingbacks