THIS TUTORIAL IS CURRENTLY BEING REVIEWED AS OF MARCH 2025. Please contact us for the latest guide.
Overview
Interpine’s Forest Yield Toolbox is available for use with ArcDesktop and ArcGISPro for use with LiDAR Imputed nearest neighbour grids. This provides our clients with access to simple and effective ways to manipulate forest yields generated from LiDAR based forest yield imputation inventories.
The following provides an overview of the use of the software ArcGIS toolbox.
What’s New
The latest software release notes and feature availability is shown below.
| Version | Release Notes |
|---|---|
| V3 | Updated toolbox, with raster tools converted to GDL to allow for use without Spatial Analyst. |
| V2 | First release for ArcGIS Pro |
| V1.71 | Last version supporting ArcGIS Desktop. This version of the toolbox will continue to be support for bug fixes for those needing, but no new features will be added. |
Glossary
| Term | Glossary |
|---|---|
| ProjectId | Example: PML24 == Client Reference = P, Project Reference = M, LiDAR Inventory = L, Year = 24 (2024) |
| PlotId | Example: PML24R1 == ProjectId = PBL24, Dominate Plot Species = R (radiata), Plot Number = 1 |
| k Value | k is a user-defined constant which defines the number of (k) training reference plots used to represent and provide an average or weighted average for the queried AOI. You will generally be guided by the Project Forest Inventory Yield Report on the best choice of k as it depends upon the data, the model analyst provides for an optimized value of k for the project. Values of 1 or 3 are typical. Generally, larger values of k reduce effect of the noise on the resulting yield tables but will make boundaries between classes less distinct. You can only select a number for which k values are available within the kNN Grid selected in the analysis. |
Forest Yield Geodatabase
Every LiDAR forest yield imputation project output is provided initially as a Geodatabase containing the following outputs.
- kNN_Grid, a nearest neighbour grid (referred to as the kNN Grid) in the form of a point shapefile.
- PlotYield, a reference table of plot yields.
- AOI, an original forest yield project area of interest in the form of a vector polygon shapefile.
Some organizations might choose to make this geodatabase read-only. Selecting to store
kNN Grid
A project will be provided with a “kNN_Grid_ProjectId”, that forms the basis of the forest yield imputation model developed. yield imputation Every LiDAR yield table imputation project will produce a final kNN grid which is the base for all yield tables. The kNN grid consist of the following attributes:
| Field | Description |
|---|---|
| Grid_ID | a unique grid cell identifier |
| X | x coordinates for the center point of each grid cell (supplied in specified project projection) |
| Y | x coordinates for the center point of each grid cell (supplied in specified project projection) |
| k_1 | Nearest neighbor reference PlotId most closely describing grid location. |
| k_1_weight | Optional – weighting of nearest neighbor k_1. A value from 0-1. |
| k_2 | Nearest neighbor reference PlotId next most closely describing grid location. |
| k_2_weight | Optional – weighting of nearest neighbor k_2. |
| k_3 | Nearest neighbor reference PlotId next most closely describing grid location. |
| k_3_weight | Optional – weighting of nearest neighbor k_3. |
Plot Yield Table
A yield table generated for each PlotId. It must contain at a minimum the PlotId and PeriodNumber. This often is developed from a Yield Request as an output from YTGEN but can also be provided by 3rd party forest yield models. The remaining fields are optional and will depend on the analysis being conducted. To serve as a basis of reference these are the typical fields you might expect inside a Plot Yield Reference Table. See YTGEN Help if using this for more information.
| Field | Description |
|---|---|
| PlotId | Mandatory, Provides a reference to the plot reference in which the yield applies to. Matches the PlotId found in the kNN grid. |
| PeriodNumber (mandatory) | Mandatory, Calendar Period of the Yield Table as represented in decimal format e.g. 2024.5 = 1 July 2024 |
| ReferencePlotAge | Years since establishment. Each plot has a single age. |
| HarvestType | E = Clearfell, U = Thinning |
| BasalArea | Area weighted average basal area; stem cross sectional area inside bark at breast height (m2/ha) |
| TopHeight | Weighted average top height. Top height is defined at the plot level as the average height of the primary leaders of the largest 100 trees per hectare where size is measured in terms of the dbh of the primary leader of that tree. If there are no trees in a plot the top height is missing, not zero, and does not contribute to stratum averages. (m) |
| Stocking | Stems per hectare. This measure includes all stems that have a presence at breast height. (1/ha) |
| MerchantableStems | The number of stems per hectare (SPH) that produce recoverable volume. This could be greater than stocking because there is no requirement that a stem have a presence at breast height to be included. (1/ha) |
| TotalStemVolume | Total Stem Volume (TSV). This is the total volume of all logs produced, including non-recoverable logs. This measure is only available after log-making. (m3/ha) |
| StandingPieceSize | TSV divided by Stocking (m3) |
| TotalRecoverableVolume | Total recoverable volume (TRV). The total volume of recoverable logs. (m3/ha) |
| MerchantablePieceSize | TRV divided Merchantable Stems. (m3) |
| 300Index | NZ based 300 Index value if applicable. |
| SiteIndex | Species specific Site Index value if applicable. |
| GradeVol_A .. GradeVol_B etc .. | Log volume based on a cutting strategy grade name. There would normally be a column in the table for every grade name or aggregated name. |
AOI – Area of Interest
A vector-based polygon feature, typically forest, compartment, stand, harvest area delineation, cutover area, custom area of interest. The shapefile should be in the same projection as the project’s kNN_Grid, however if not the tools will temporally re-project to match the kNN Grid projection. Many of the forest yield tools will request a field within the feature attributes to aggregate yields by. For example this might be “CutoverDate” or “FullStandId”, but can be any attribute you wish to summarize yields by.
Toolbox Functions
Imputation – Create Yield for AOI Selection
This tool generates a yield table based on the distinct aggregation field values, as a function of the polygon attributes defined by the AOI feature. If any AOI polygons are selected prior to running this tool, the resultant yield tables will only include selected polygons. If no polygons are selected a yield table will be generated for every polygon.

| Parameter | Description / Use |
|---|---|
| Area of Interest | Select or drag and drop the Area of Interest feature layer from the contents window. |
| k | Enter a k value from 1 to 3. |
| Plot Yield Table | Select a CSV file Plot Yield Table from a windows directory folder, or if loaded into the current project you can drag and drop the table from the content window. |
| OUTPUT: Summary Yield Table | Output location and name for the resulting forest yield table. It is suggested to publish results to either; your own Geodatabase – this being for personal or adhoc analysis which is not needed by a wide group, thus keeping the original kNN Geodatabase tidy and clear from lots of ad-hoc yield analysis results. company or team Geodatabase – this being for published forest yields that can be accessed and used by a wider group. Where possible avoid outputting results directly back into the kNN Imputation geodatabase, this will avoid confusion and bloating this database with latest numbers of yields for other users to sort through and clearup. NOTE: Some organization might choose to make the kNN geodatabase readonly for this reason. |
Imputation – Create Yield Raster Layer
This tool generates a raster for each field in the reference plot yield table. Rasters are saved in the selected folder and needs to be loaded after running the tool. The raster pizel size is based on that of the grid. If any AOI polygons are selected prior to running this tool, the resultant raster will be clipped to the extent of the selected polygons. If no polygons are selected the resultant raster will cover the entire kNN Grid. Raster is automatically named as a concatenation of selected Period Number and yield table fields e.g. 2018.5_TotalRecoverableVolume.tif.


| Parameter | Description / Use |
|---|---|
| Area of Interest | Select or drag and drop the Area of Interest feature layer from the contents window. |
| Grid kNN | Select or drag and drop in the kNN Grid feature layer from the contents window. NOTE: The kNN Grid must be loaded into the project contents, but does not have to be active (viewed). |
| k | Enter a k value from 1 to 3. |
| Plot Yield Table | Select a CSV file Plot Yield Table from a windows directory folder, or if loaded into the current project you can drag and drop the table from the content window. |
| Period Number | Period Number (numeric field representing typically a calendar year is a real number. An integer year specifies 1 January of that year. Must be a valid field value for Period Number from the Yield Table selected. This will limit the raster created to a single period. |
| Output Raster Folder | Select the output folder to store the raster’s created. |
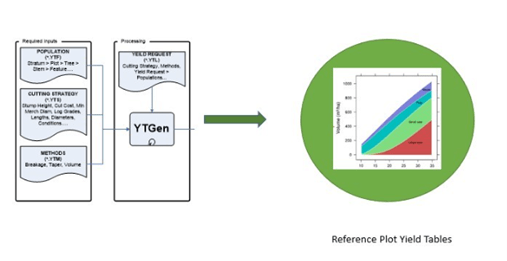
Imputation – Create Plot Yield Table from YTGEN Output
This tool converts a YTGen Yield Request output file into a Plot Yield Table format which is used to generate yields for any AOI. YTGEN output format used is the “unformatted text file” output.
Each reference plot is stored as a population file and as such, it is important to run YTGen with the Edit & Output options shown below. Remember the start period and path of the output text file.

| Parameter | Description / Use |
|---|---|
| YTGEN Yield Output File | YTGen can write output into text files for later processing. Select the unformatted text file as created by YTGen from a yield analysis (*.txt file). Note: This version of output as the text output is the only output method supported by the console version of YTGen which is often used for scripted yield analysis, thus enabling greater flexibility for end users. |
| Start_Year | YTGen period start date eg. 2018.5 Currently the output of YTGen does not provide the actual period, rather than incremental reference and hence the need for us to know the starting date. |
| OUTPUT: Plot Yield Table | Output location and name for the resulting forest yield table. It is suggested to publish results to either; your own Geodatabase – this being for personal or adhoc analysis which is not needed by a wide group, thus keeping the original kNN Geodatabase tidy and clear from lots of ad-hoc yield analysis results. company or team Geodatabase – this being for published forest yields that can be accessed and used by a wider group. Where possible avoid outputting results directly back into the kNN Imputation geodatabase, this will avoid confusion and bloating this database with latest numbers of yields for other users to sort through and clearup. Some organisation might choose to make the kNN geodatabase readonly for this reason. |
Run YTGEN Yield Table
This tool runs YTGen remotely and loads a reference plot yield table in the contents pane for easy access.
It is important to note that the paths to folders or files used in YTGen do not contain blank spaces in them as this will cause YTGen to crash.
| Parameter | Description / Use |
|---|---|
Workflow Examples of Using the ToolBox
Create a Yield Based on a Recent Cutover Markup Area
Create a Yield for a Current Stand or Harvest Area
Recreate Yield Tables based on a New Grade Selection
Create Yield Attribute Raster Surfaces
Further Support
Thanks for using TreeTools Forest Yield Toolbox.
We wrote these articles to equip you with everything you need to get the job done on your own, but we understand that sometimes this isn’t sufficient.
If you’re stuck, the Interpine support team may be able to help. You can contact them by submitting a contact request.