Which trees should be height trees?
Tree heights are among the most time consuming and difficult measurements to take in a forest inventory. The measurer must be an adequate distance away from the tree to get an accurate measure of height (angle to tip must be <50 degrees from horizontal), and must also find a location where the top and reference height (often DBH) of the tree can be clearly sighted. As a result height is generally only measured on a sub sample of the trees in a stand, as opposed to diameter at breast height (DBH) which is measured for every tree; therefore the field team must decide which trees to measure height on. During the conversion of Plotsafe forest inventory files into YTGEN format a tree height is calculated for all trees where height has not been measured. Height and DBH data collected from the stand is used to build a relationship between tree height and DBH so it is important that tree heights are measured from trees across the diameter range present in the population. This will improve the precision of the height predictions which will be more accurate when within the range of the data used to fit the model. This is based on the assumption that in any one set of trees in a stratum the larger the diameter of the tree, the taller it is. Height measurement should also be avoided on trees with excessive lean, trees exhibiting edge effect, or broken top or dead tops.
How many tree heights should be collected?
In general more tree height measurements will lead to a better fit for the diameter-height model used by YTGEN. Generally a different regression analysis is used to fit a height diameter curve for each stratum in an inventory so a minimum of thirty heights should be measured in each stratum (Maclaren, 2000). This will ensure that there are enough data points to build a relationship between DBH and height. Height trees should be collected throughout the stratum and in practice measuring 2 to 3 height trees per plot is often sufficient get more than the minimum of 30 height measurements (reducing the measurement error involved by taking more measurements throughout the inventory).
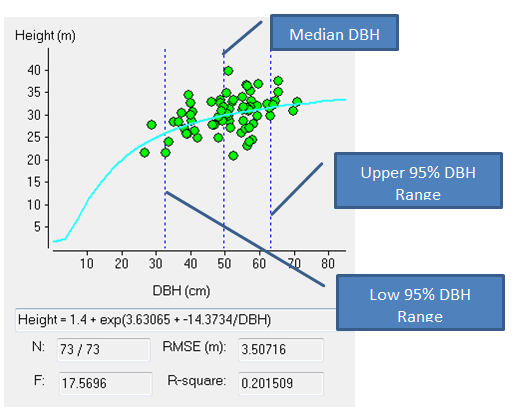
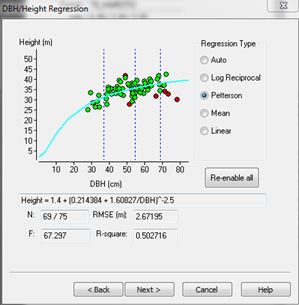
You can see in the DBH-HT graphs below; Figure (A) shows too few heights and an extreme where the regression curve actually has a negative slope indicating the smaller the trees the taller they are; Figure (B) showing a large number of tree heights collected; even so most of the heights taken were of larger trees and therefore the prediction of height of trees below the mean DBH will be less precise; Figure (C) showing an ideal spread of heights across the DBH range of the data.
(A)
(B) 
(C) 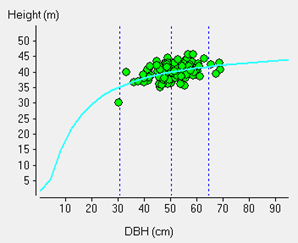
How do we fit the diameter height regression?
YTGEN provides a graphical interface where users can derive regression coefficients based on the trees where both height and DBH have been measured. The regression coefficients are then used to predict the height of a tree based on its DBH. The diameter height regression interface can be accessed by choosing to export a Plotsafe file to YTGEN from the file menu in the desktop version of Plotsafe, or during the import of MARVL datafiles into YTGEN. As there is great variation between forest stands there have been many functions developed to fit diameter height curves, in YTGEN users are given an option of four regression types. The YTGEN regression screen contains a scatter graph which provides users with a visual indication of:
- whether diameter is a good predictor of height;
- whether the selected model is a good fit to the data;
- whether there are problems with the data, like outliers;
- how well the measured diameter/height pairs represent the population of diameters from which the height trees were selected.
If there are outliers in the population users can exclude these from the regression analysis by clicking on the outlier point in the scatter graph, the point will turn from green to red to indicate that it is excluded. A number of results are also displayed in the regression screen including root mean square error (RMSE) and R-square value. The RMSE is usually the most useful in this context as it allows you to measure the differences between heights predicted by a regression model and those actually observed, and hence is a good measure of precision. These individual differences are also called residuals, and the RMSE serves to aggregate them into a single measure of predictive power. So a RMSE of 2.67m explains that the standard deviation for the prediction of height by the regression. This is often more useful that the R-square which may sometimes be very poor (<0.5), but the RMSE is very small and relatively acceptable for a 30-40m high tree.
What if I have a mixed species stand?
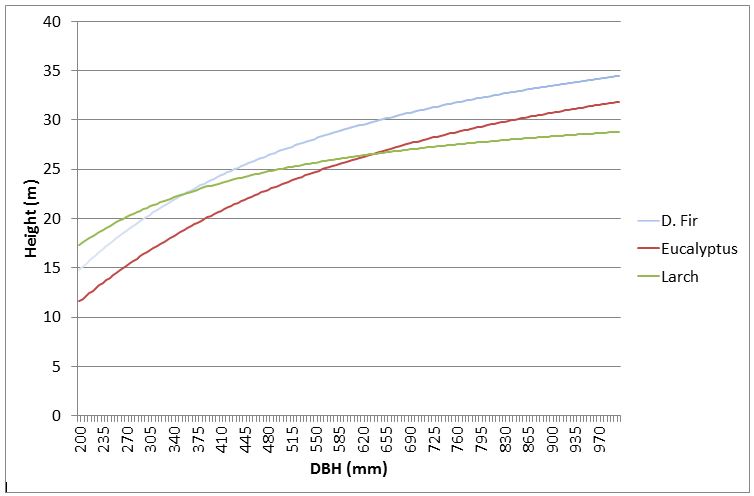
Tree growth patterns are sometimes species specific (dependent on the stand structure) and so some users have debated the need to separate diameter height curves by species for each species in a mixed species stand. YTGEN does not currently provide an interface for fitting species specific regressions for non-stratified mixed stands. To assign tree heights in mixed species stands Interpine have developed a procedure, using the R statistical computing package, which derives specific regression coefficients for each species in a mixed stand and inserts a tree modelled height, derived from tree DBH, into the YTGEN file for further analysis. Before taking this step it will be important to understand if this is required as we have often seen in mixed species stands the difference in the derived RSME for each species regression is little different from that of the entire stratum and so indicating that separate species curves are not required. If a separate species regression does need to be applied please free to contact us.
If you would like more information about modelling tree height in YTGEN or would like Interpine’s assistance with your forest yield analysis then get in contact with our Rotorua head office.
References:
Maclaren, J; 2000, How Much Wood Has Your Woodlot Got? FRI Bulletin 217, Rotorua, NZ